View series-level analytics for your virtual event in one comprehensive easily digestible dashboard.Reporting is updated in real-time, giving you the most current picture of your event performance.
You can view series-level analytics for your virtual event in one comprehensive easily digestible dashboard.Reporting is updated in real-time, giving you and your stakeholders the most current picture of your event performance.
Additionally, you can send and schedule emails containing these analytics — and add subscribers to that list.This keeps key stakeholders in the loop without demanding additional time and resources.
View our new analytics dashboard below — and continue reading to learn more about what we measure.
Learn more about the Analytics Reporting Dashboard below.
Click below to be redirected to the sections:
How to View the Analytics Dashboard
1.Log in to the Series associated with your event and select theManage Seriestab.On that page, selectManage Event.

2.From there, you'll proceed to your Event Setup page.On the left-hand menu of this page, selectAnalytics.
3.You'll then proceed to your virtual event's analytics dashboard.You can find more specific data about individual sessions, attendee engagement, etc.on each tab of this page.In the next section is an overview of each tab — as well as the insights and information stored in each.

Registration
In theRegistrationtab, you can see:
- how attendees registered for your event
- the total number of registrations
- the number of daily registrations by source
- your event's most common traffic sources

On theRegistrationtab, the analytics are shown in real-time (excluding data selected in a specific time range).You will see the number of registrants for your main series.Within each section, there are green numbers/percentages that also show real-time data.For the registrants section, you will see how many registrants are there with the percentage being the amount of registrants over the time period of registration.
Unique Visitorsare those users who have visited your page.They haven't fully registered yet, but they are online visitors.You can view the percentage of real time visitors you have by the green percentage on the right hand side.
ThePaid Ticket Salesis the total amount of ticket sales you have for your event.This will show the full amount of money and increase in real time when more sales have been made.If there are any coupons for your event, the analytics will include that number in the total amount.
ThePaid Tickets Soldwill show the total number of paid tickets sold.This number will not include any tickets purchased with coupon codes.
Scrolling down the page, you will see an interactive line graph for yourTotal Registrantsacross a time frame.Here, you can see the increases, decreases or stagnation of the amount of registrants for your event.This data is dependent on the time frame selected.You can select the time frame for the data to be displayed at the top right hand corner, next toRun Reports.

The next graph displaysDaily Registrations by Source.Here, you can view the daily registrants by source, such as direct sources, email, social media, import and other.A quick overview of each source:
- Direct- These registrants are directly from the BigMarker platform
- Email- These registrants were from email invitation
- Social Media- These registrants were from Facebook, Twitter, LinkedIn, Instagram, TikTok, etc.
- Import- These registrants are added by a Presenter through CVS file and/or manual upload
- Other- These registrants were integrated into the platform typically by registering through referrals.

These analytics are pulled from the selected time frame and will display accordingly.From there, you can see how the number ofTicket Sales by Pass TypeandTicket Coupon Usage.
TheTicket Sales by Pass Typesection displays all the passes associated with your main series with the amount of sold tickets and the revenue generated from sale.
TheTicket Coupon Usagesection will show the amount sold and then deduct that number from any coupon codes utilized.Overall, this section will show the coupon codes utilized and the amount of registrants who utilized the code.

TheRegistrants by Countryinteractive map is a scrollable, sizable map that displays the number of completed registrations by country.These analytics are recorded with the registrant's use of their IP address.This information is gatheredonlyif attendees register directly on the site themselves, not through another source.
TheRegistration Sourcessection measures the quantity of traffic and the percentage driven through Email, Direct, Social Media, Import or Other channels.

TheTop Referral Sourcessection ranks your event's most effective referral sources based on the number of completed registrations that came in through each channel (Facebook, LinkedIn, Twitter, BigMarker).Traffic Sourcescompares the performance of different marketing channels like email and direct marketing, whereasTop Referral Sourcesconsiders only the performance of referral links on social media.
(If there is a percentage for Other, that means that the registrants were registering from the email invitation through the direct link.If there is a percentage for BigMarker, that means that the registrants were registering from the register link on a BigMarker landing page.)
TheTop UTM Codes Analyticsranks individual UTM codes by the number of completed registrations generated via each individual link.(This is a good way to identify the most active promoters among your event partners, sponsors and affiliates — and evaluate the success of individual marketing campaigns.)
Audience
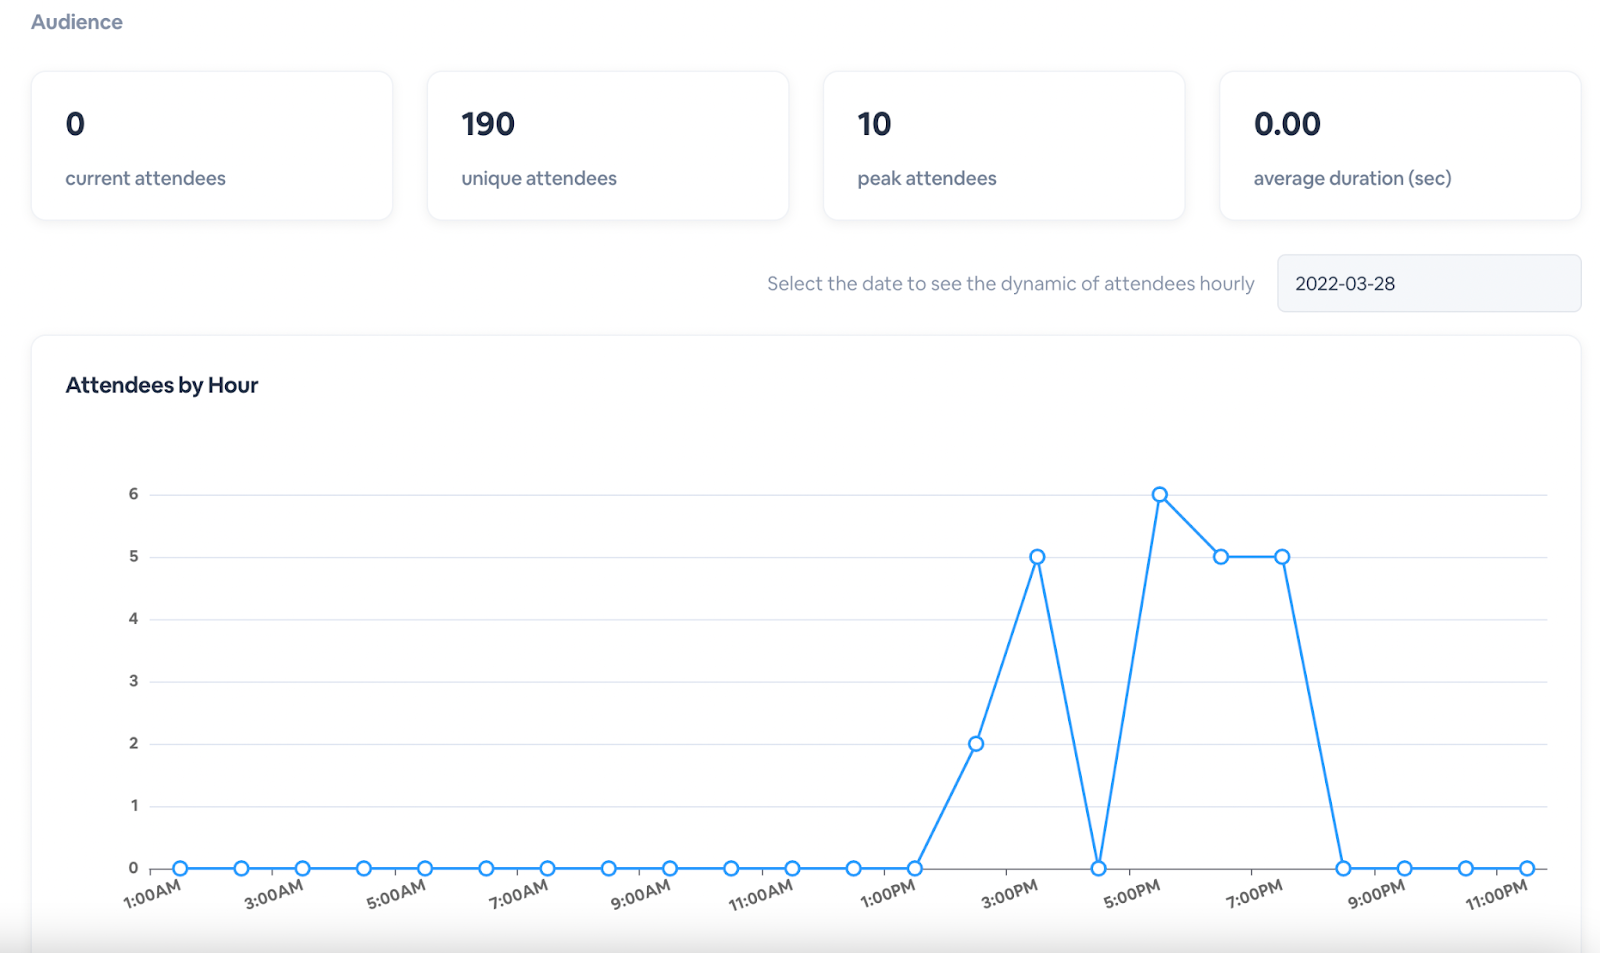
TheAudiencetab will show all the attendees analytics for your event, such as the current attendees in any associated webinars, unique visitors, peak attendees, average duration they were at your event and more.Right off the bat, theAudiencesection will show all the current attendees visiting any live webinars or evergreen webinars associated with your main event.
TheUnique Attendeessection will show those attendees with their own BigMarker ID who have visited your events.These can be any BigMarker ID attendees throughout the website and not just registered with your event.
ThePeak Attendeessection will show the highest number of attendees who visited your event in the time frame selected.
TheAverage Durationsection will show the average time an individual attendee spends in the session (in seconds) per the date range selected.
Moving down the page, you will see an interactive line graph forAttendees by Hour.Here, analytics will show the amount of attendees visiting your event per day per hour.This takes into account total attendance across all webinars and sessions in your event.You can select the time range in theSelect the date to see the dynamic of attendees hourly dropdown menu.
Below the interactive line graph will be another set of 4 separate boxes that show different data points.
- Visits per Attendee- This is the total number of attendees divided by the number of page views
- Sessions per Attendee- This is the average number of sessions attended during the selected time frame
- Multi-day Attendees- This is the number of attendees who visited your event more than once in a day during the selected time frame
- Countries Presented- This is the number of countries represented by the attendees at your event during the selected time frame.

TheAttendees by Daysection displays the number of attendees present on each day of your event.Select the time frame of choice and you will see the number of attendees that attended your event per day.Hover over the bar to view how many attendees were in your events on specific days.

From there, you will have two separate sections:Attendees by CountryandAttendees by Device.The Attendees by Country section will show you where the attendees are in the country based on their IP address, while Attendees by Device will show you which devices attendees used to visit your event.Hover each graphic for more information about individual countries represented or devices used.

TheCountries Representedsection lists the number of attendees by country, in descending order.
Attendee Flow
TheAttendee Flowtab lists all of the series (i.e., the Expo Hall, the Networking Center) and webinars (i.e., individual sessions or exhibitor booths) that are activated under the main series.These will show as modules where you can observe in real-time how many attendees are currently in specific live webinars.
For each module, you will see the overall number ofcurrent attendees, total unique session attendees, current unique visitors, total unique visitors, total visits,andthe number of sessions.If there are other webinars or sessions associated with that module, they will appear below as a dropdown menu where you can view the specific analytics for that webinar/session.
For example, in the Expo Hall, you can view each Expo Booth's individual attendee flow analytics.

Below the Module Table is theHourly Visitline graph, which shows the number of hourly visits during a selected time and date range.We recommend selecting the exact dates of the event for a better dynamic display.
If your selected date range selected is 3 days or less, the chart will display only the time (AM/PM) on the X axis.If your selected date range exceeds 3 days, then the date and month will also appear on the X axis.

Content
TheContenttab shows the most popular content, engagement features, sessions, chat rooms and more.This is where you will be able to identify your event's most popular sessions, booths and networking opportunities.
Under Most Popular Sessions is a list of the most popular sessions.This includes all the webinars (live and evergreen) associated with the main series.In each row is thename of the session, what track it's located within, how many attendees attendedand theother engagement features, such asQ&A, chats, offers,andhandouts.

From there, you can identify theMost Popular Tracks (Session Attendance), Most Popular Chat Rooms, Most Popular ExhibitorsandMost Popular Speakers.These are listed in descending order.

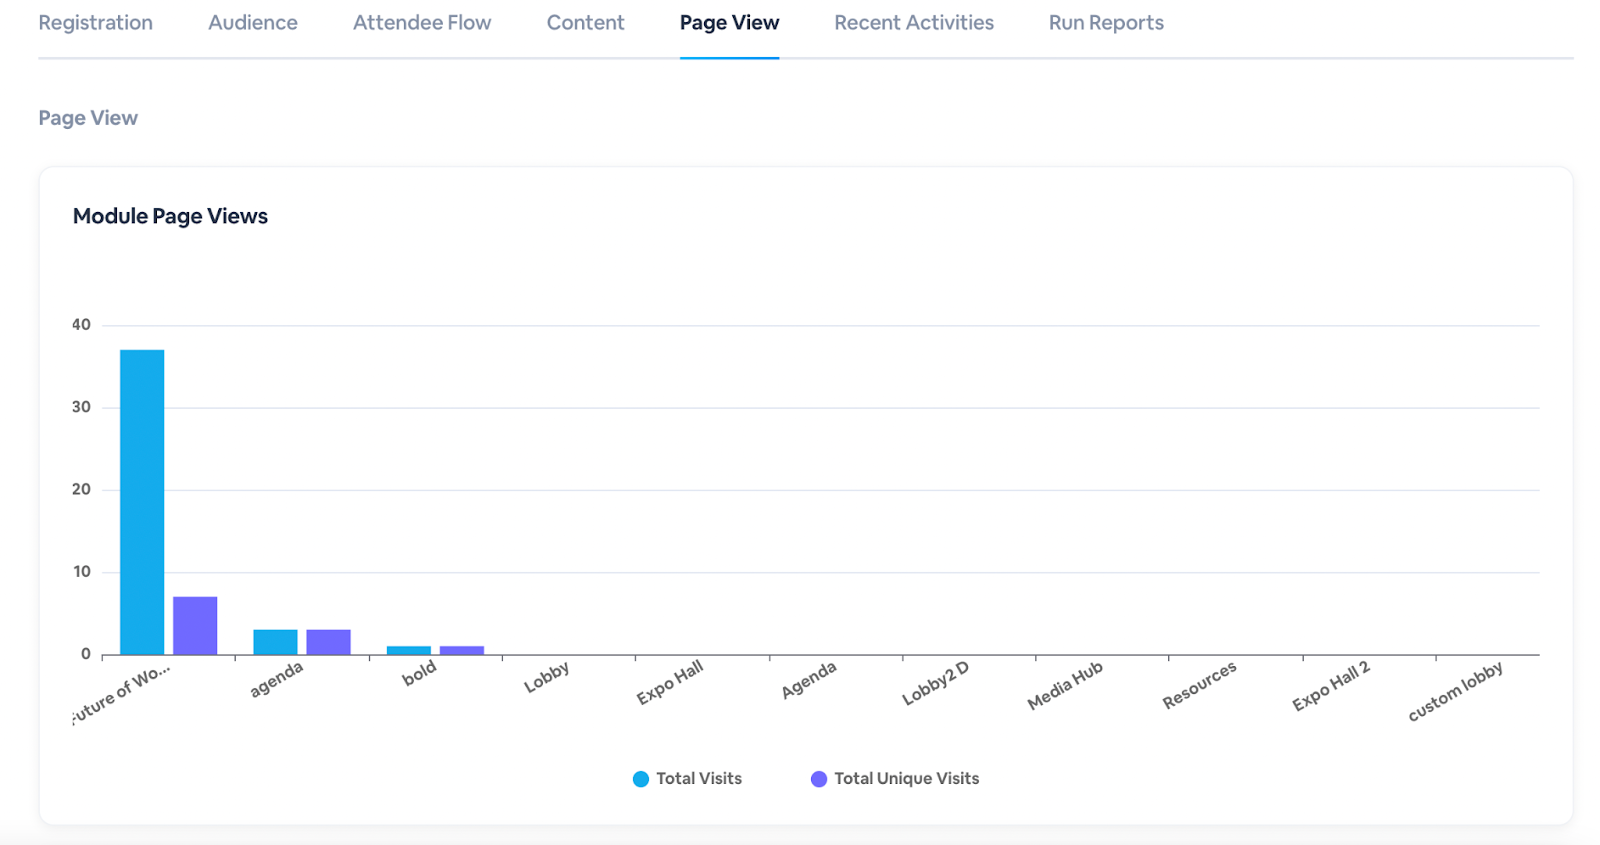
Page View
ThePage Viewtab displays the individual page views and unique visits combined for various modules within your Virtual Event.This includes total page views forModule Page Views, Networking Center, Check-In, Networking, Lounge, the Favorited Contacts tab, Round Tables, Our Partners,and the On-DemandLibrary.
Recent Activities
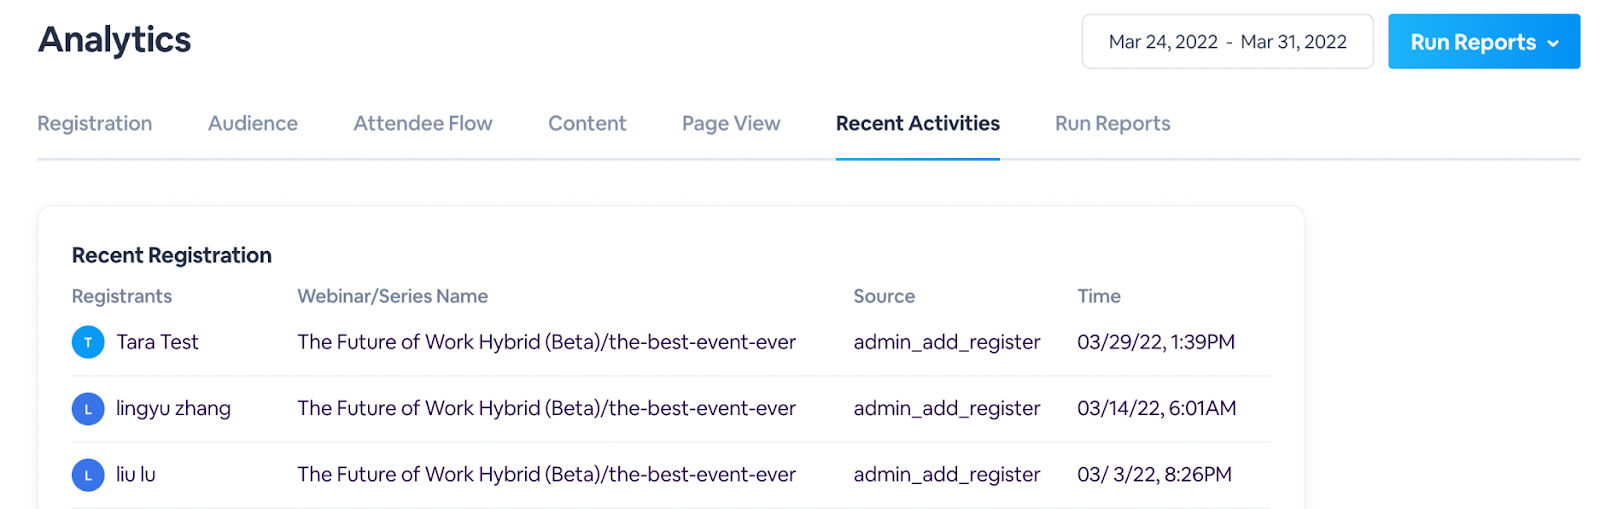
TheRecentActivitiestab shows the most recent activity associated with your virtual event, including recent event and session registrations.
Under theRecent Registrationsection is all recent registration activity.This include theregistrant's name, the webinar or series they registered for, their registration sourceand theregistration time and date.You can also head over to theManage Registrationsection on your main series admin by clickingManage Series Registration.
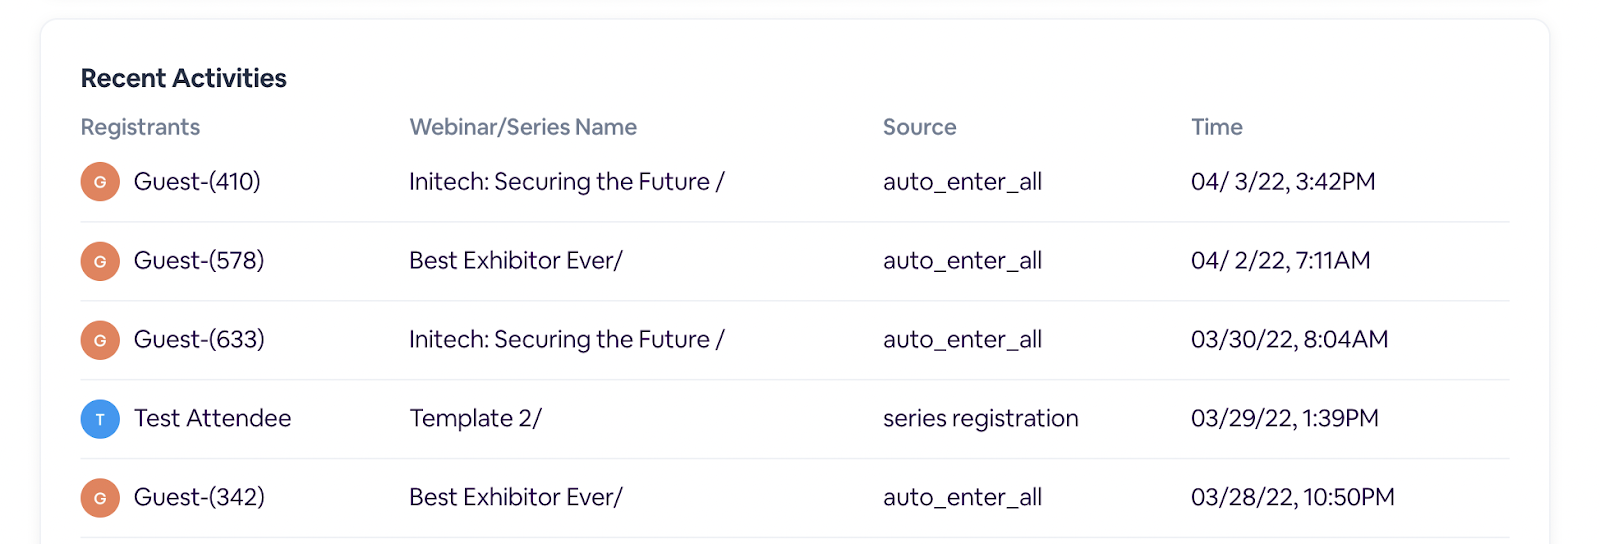
Under Recent Activities is a list of the most recent entries to individual sessions or booths.Under the Source column, you can see how each participant entered the session (whether they were redirected to the session or they registered for it on their own).
Run Reports
InRun Reportstab, you can send your event reports via email immediately or schedule them to send at another time.Each email links to a zip file containing all of your requested reports.
Want key stakeholders to receive analytics at consistent intervals throughout the event?You can add subscribers that will receive the overall event report consistently and at scheduled times.
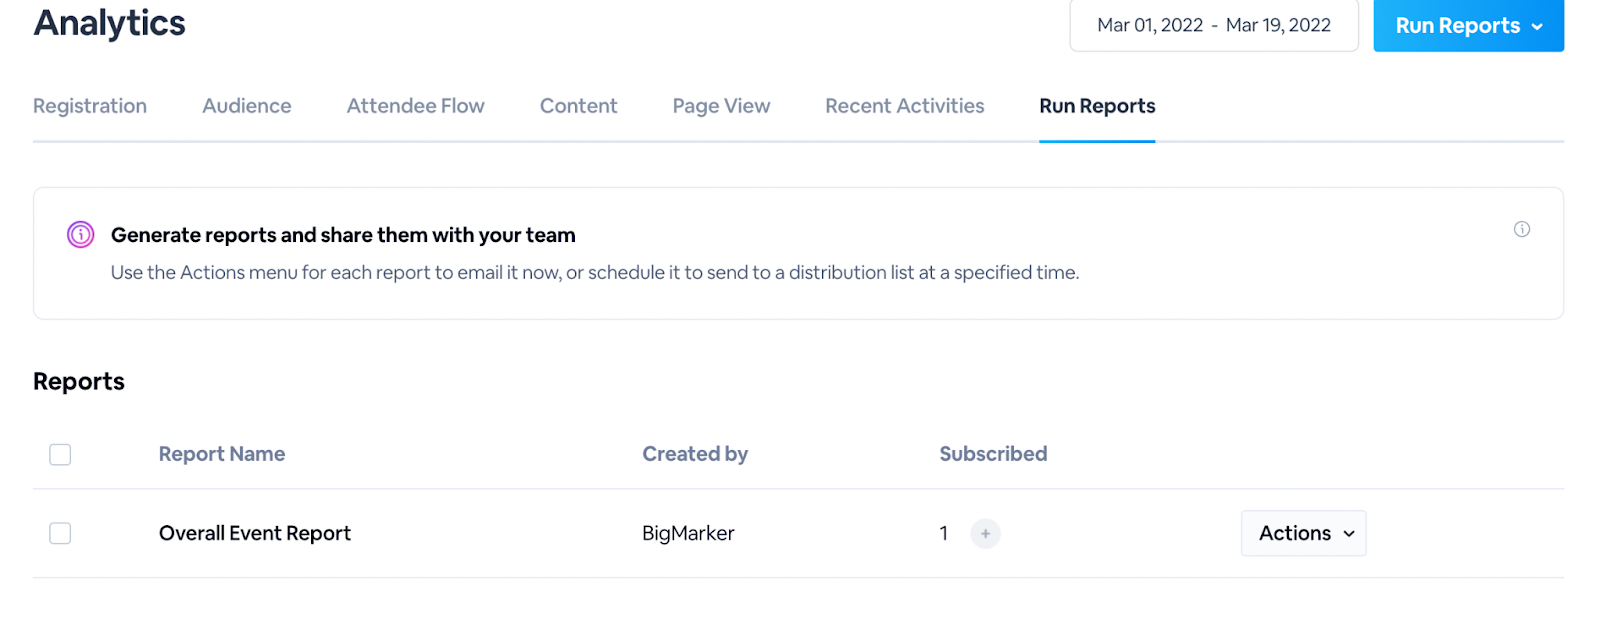
To add subscribers, click theplus button +and use the dropdown menu to select presenters/admins — or enter their individual email addresses in the provided text box.ClickSaveto continue.You can also delete recipients from the list by clicking thetrash can icon.
From there, you can select to send the report immediately or schedule it to send at a later time.You can also start an email report to be sent by clickingScheduleunder theActionsdropdown menu.

To Send an Overall Event Report Now
1.SelectSend Now
2.Customize theemail messageif desired
3.Click the+button to edit the recipients if needed
4.ClickSchedulewhen finished

The overall event report will be sent automatically to the recipients.
To Send an Overall Event Report at a Scheduled Time
1.SelectSchedule to Send
2.Select thedate and timeto send the report
3.Customize theemail messageif desired
4.Click the+button to edit the recipients if needed
5.ClickSchedulewhen finished.

After scheduling the email's send time, you will be redirected to theHistoryof your event emails.Here, you can view upcoming emails, as well as previously sent emails.You can also cancel a scheduled email by clicking the three dots shown below and clickingcancel.

